

A lab report isn’t a diary of what happened in the lab. It’s closer to a witness statement, clear, accurate, and easy to check.
If your marks keep dropping for “analysis” or “quality of communication”, the fix is rarely more writing. Better lab report writing means making each section do its job, with evidence that matches your conclusion.
Key Takeaways
- Write for a reader who wasn’t in the room, they should still understand and repeat your work.
- Follow your teacher’s required structure first, then improve clarity within it.
- Methods need exact steps, measurements, and control variables, not a story.
- Results should be tidy and readable, with units, sensible tables, and clear graphs.
- Discussion is where you explain patterns, uncertainty, and improvements, using your data.
Table of Contents
- Key Takeaways
- Know What The Marker Wants Before You Start
- Build The Report Using A Clear, Standard Structure
- Write Methods And Results So They’re Easy To Mark
- Write A Discussion That Earns The Top Band
- Conclusion
- Frequently Asked Questions About Lab Report Writing
Know What The Marker Wants Before You Start
Before you type anything, open your task sheet and mark scheme. Then write a quick “skeleton” with headings in the right order. This stops you from forgetting a section, or spending half the word count on the wrong bit.
Next, decide what your report is trying to prove. Most school practicals assess three things:
- you carried out a fair test (or followed a safe method)
- you recorded results properly
- you can explain what the results mean
So, don’t hide the big picture. Put your aim and hypothesis where they’re easy to find, and keep them consistent all the way through.
If you’re unsure what a formal lab report should look like, compare your format with University of Sheffield’s guidance on lab report structure{:rel=”nofollow” target=”_blank”}. You still need to follow your class rules, but it’s a useful reference for what “good” includes.
A strong report feels calm and organised, because the reader never has to hunt for key information.
Build The Report Using A Clear, Standard Structure
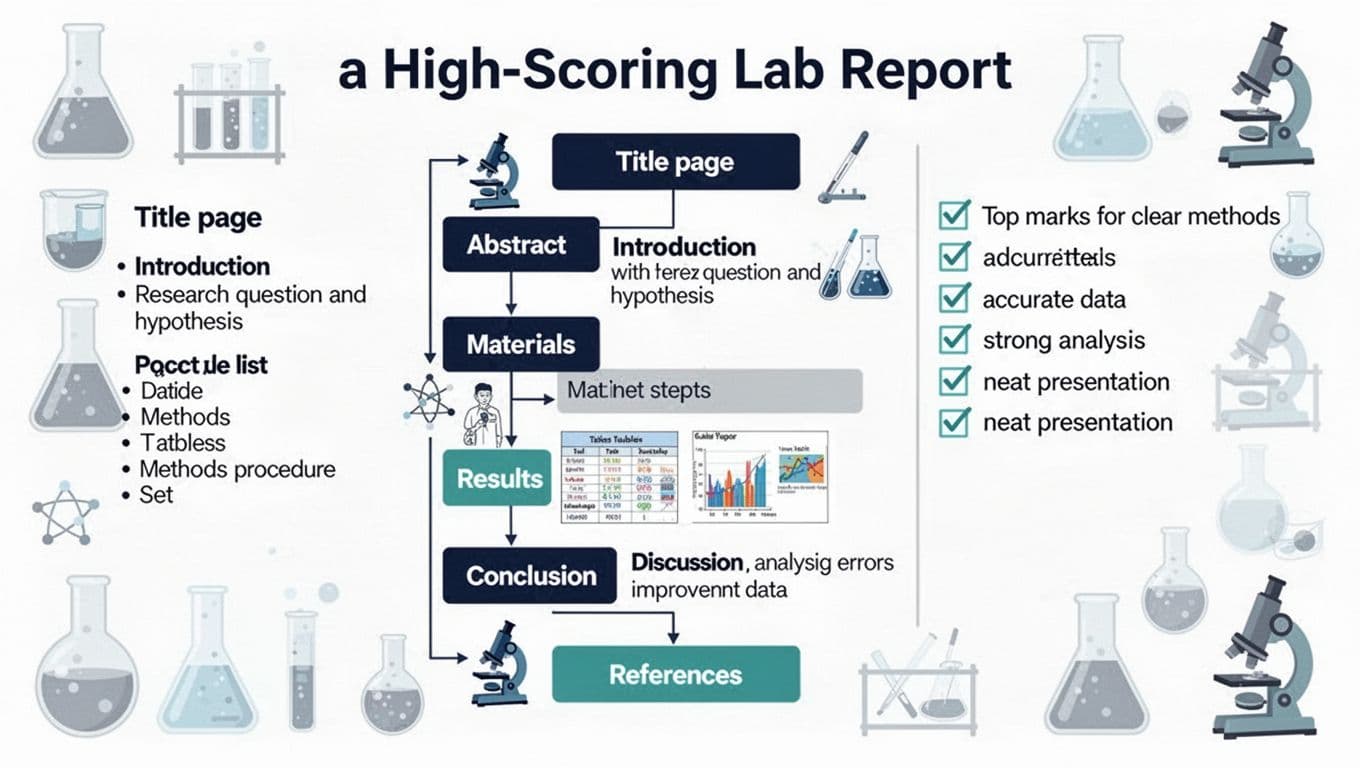
A Quick Tour Of What To Write In Each Section
Start with the basics, then add detail where marks are available.
Title: Name the investigation and key variable (for example, “Effect of Temperature on Enzyme Activity”).
Abstract (if required): 4 to 6 lines on aim, method, main result, and conclusion. Write it last.
Introduction: Brief background science, then your research question and hypothesis. If you need help revising theory before you write, use resources like integrating lab experiments with chemistry theory to refresh key ideas and terms.
Materials: List what you used, include concentrations and sizes where relevant.
Methods: Numbered steps, control variables, repeats, and safety notes.
Results: Tables first, then graphs, then sample calculations if needed. No opinions here.
Discussion: Explain patterns, compare to expectations, and evaluate errors.
Conclusion: One short paragraph that answers the question using your results.
References/Appendix: Only include what your teacher asks for.
Keep your writing tight. A report should feel like a well-labelled map, not a treasure hunt.
Write Methods And Results So They’re Easy To Mark
The fastest way to lose marks is to make your method vague. The second fastest is to present data that’s hard to read.
Methods That Another Student Could Repeat
Write methods as a set of actions, with measurements. Add the bits that make it a fair test.
Use this table to check you’ve covered the basics:
| What To Control | What It Means In Practice | Example |
|---|---|---|
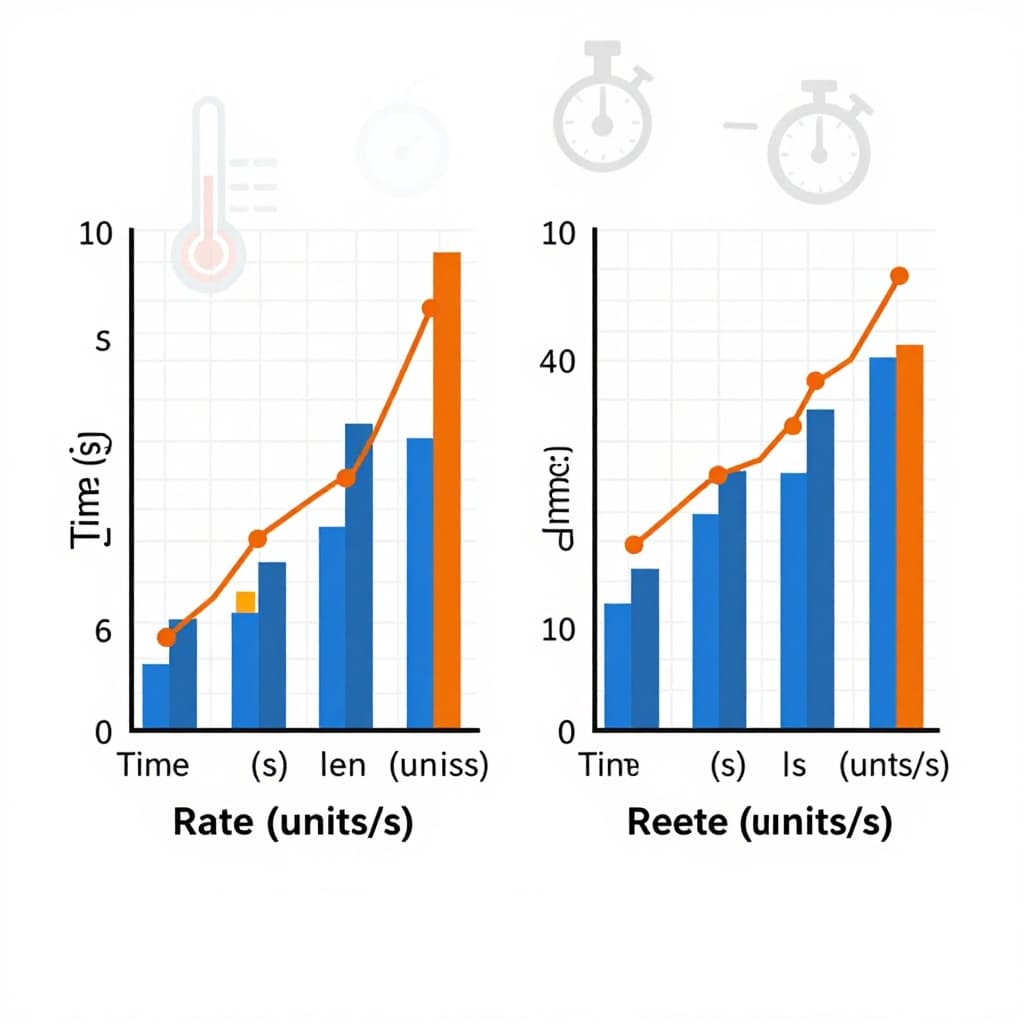
| Independent Variable | The one thing you change | Temperature (°C) |
| Dependent Variable | What you measure | Reaction rate (units/s) |
| Control Variables | What stays the same | Volume, concentration, time, surface area |
| Repeats | How you improve reliability | 3 trials at each temperature |
Also include the “small” details that matter, because teachers mark them:
- measurement tools (for example, 100 ml measuring cylinder, ±1 ml)
- timing method (stopwatch, when you started and stopped)
- how you reduced bias (same person reading the meniscus)
Don’t paste a textbook risk assessment, but do name real hazards and what you did about them.
Results That Show Your Skill With Data
Neat results save your marker’s time, and that often helps your mark.
Put raw data in a table with units in the header. Then show processed data (means, rates, percentage change) in a second table if needed. Keep decimal places consistent, and match significant figures to your equipment.
For graphs, aim for:
- a clear title (what you plotted and why)
- labelled axes with units
- a sensible scale that uses most of the page
- a best-fit line if appropriate (not dot-to-dot)
- error bars if you calculated uncertainty or used repeats
If your class uses practical write-ups often, practise recalling key terms and definitions, because it reduces waffle in your discussion. Techniques like active recall study prompts work well across sciences.
Write A Discussion That Earns The Top Band
Discussion is where you turn numbers into meaning. It should answer, explain, and evaluate, in that order.
First, state the main pattern in plain language. Then support it with evidence, including at least one data point. For example: “As temperature rose from 20°C to 40°C, the rate increased from 0.8 units/s to 1.6 units/s.”
Next, link the pattern to science you learned in class. Keep it simple, but correct. If your result didn’t match the hypothesis, say so clearly, then explain why it might have happened.
After that, evaluate quality:
- Reliability: did repeats agree, or were results spread out?
- Accuracy: did equipment limits affect readings?
- Validity: did you really measure what you meant to measure?
Then suggest improvements that match your weaknesses. “Use better equipment” is too vague. Try: “Use a 0.1°C temperature probe to reduce uncertainty.”
For extra examples of what different report sections should include, see Newcastle University’s guide to structuring a science report{:rel=”nofollow” target=”_blank”}.
Conclusion
A high-scoring report is consistent from start to finish. Your aim, method, results, and conclusion should line up like parts of the same machine. If you improve just one section, improve the discussion, because that’s where your thinking shows. Next time, write your headings first, then fill them in using your data.
Frequently Asked Questions About Lab Report Writing
How Long Should A Lab Report Be For School Science?
It depends on your teacher’s brief. Still, good reports are usually short and clear, with most space given to results and discussion.
Should I Write In First Person?
Follow your class rules. Many school reports allow first person (“I measured…”), while others prefer a more formal style. Either way, keep it direct and avoid storytelling.
What If My Results Look “Wrong”?
Don’t change them. Report what you measured, then use the discussion to explain anomalies, uncertainty, and likely errors. Honest evaluation often scores better than perfect-looking numbers.
Do I Need References In GCSE Or A-Level Practical Reports?
Only include them if your teacher asks. If you do reference, keep it simple and consistent, and only cite sources you actually used.
How Do I Get More Marks In The Discussion?
Use a repeatable pattern: state the trend, give a data example, explain with science, then evaluate errors and improvements. If you want a quick reminder to keep writing concise, ABEL’s tips for writing a great lab report{:rel=”nofollow” target=”_blank”} are a helpful checklist.

